_1@2x.png)
Getting Started With GravityCharts
In this guide, we’ll show you how to get started with the GravityCharts add-on for Gravity Forms.
Prefer to Watch the Video?
Install GravityCharts
Start by installing GravityCharts on your website. To do this, log in to your GravityView Account page, click on the "Downloads" tab and download the GravityCharts plugin ZIP file.
Now head over to your WordPress Admin dashboard and follow these three steps to install GravityCharts on your site:
- Hover over Plugins on the left and click Add New
- Click Upload Plugin and then Choose File
- Select the ZIP file you downloaded previously and click Install Now. When that’s done, click Activate Plugin.
Activate Your License
After installing GravityCharts, you’ll need to activate your license.
To do this, copy your GravityCharts license key from your Account page (if you have an All Access license, use the license key for that). Now, head over to your website, hover over Forms in the left-hand menu, and click Settings. Now click on the GravityCharts tab and paste your license key into the box.

Create a New Form With a Select Field
If you already have a form with data, feel free to skip this step.
Hover over Forms on the left and click New Form. After giving your form a name, add fields to your form using the Gravity Forms drag-and-drop editor. You can add as many fields as you want but be sure to include at least one select field (i.e. Radio Buttons, Checkboxes, Drop Down, Survey, etc).
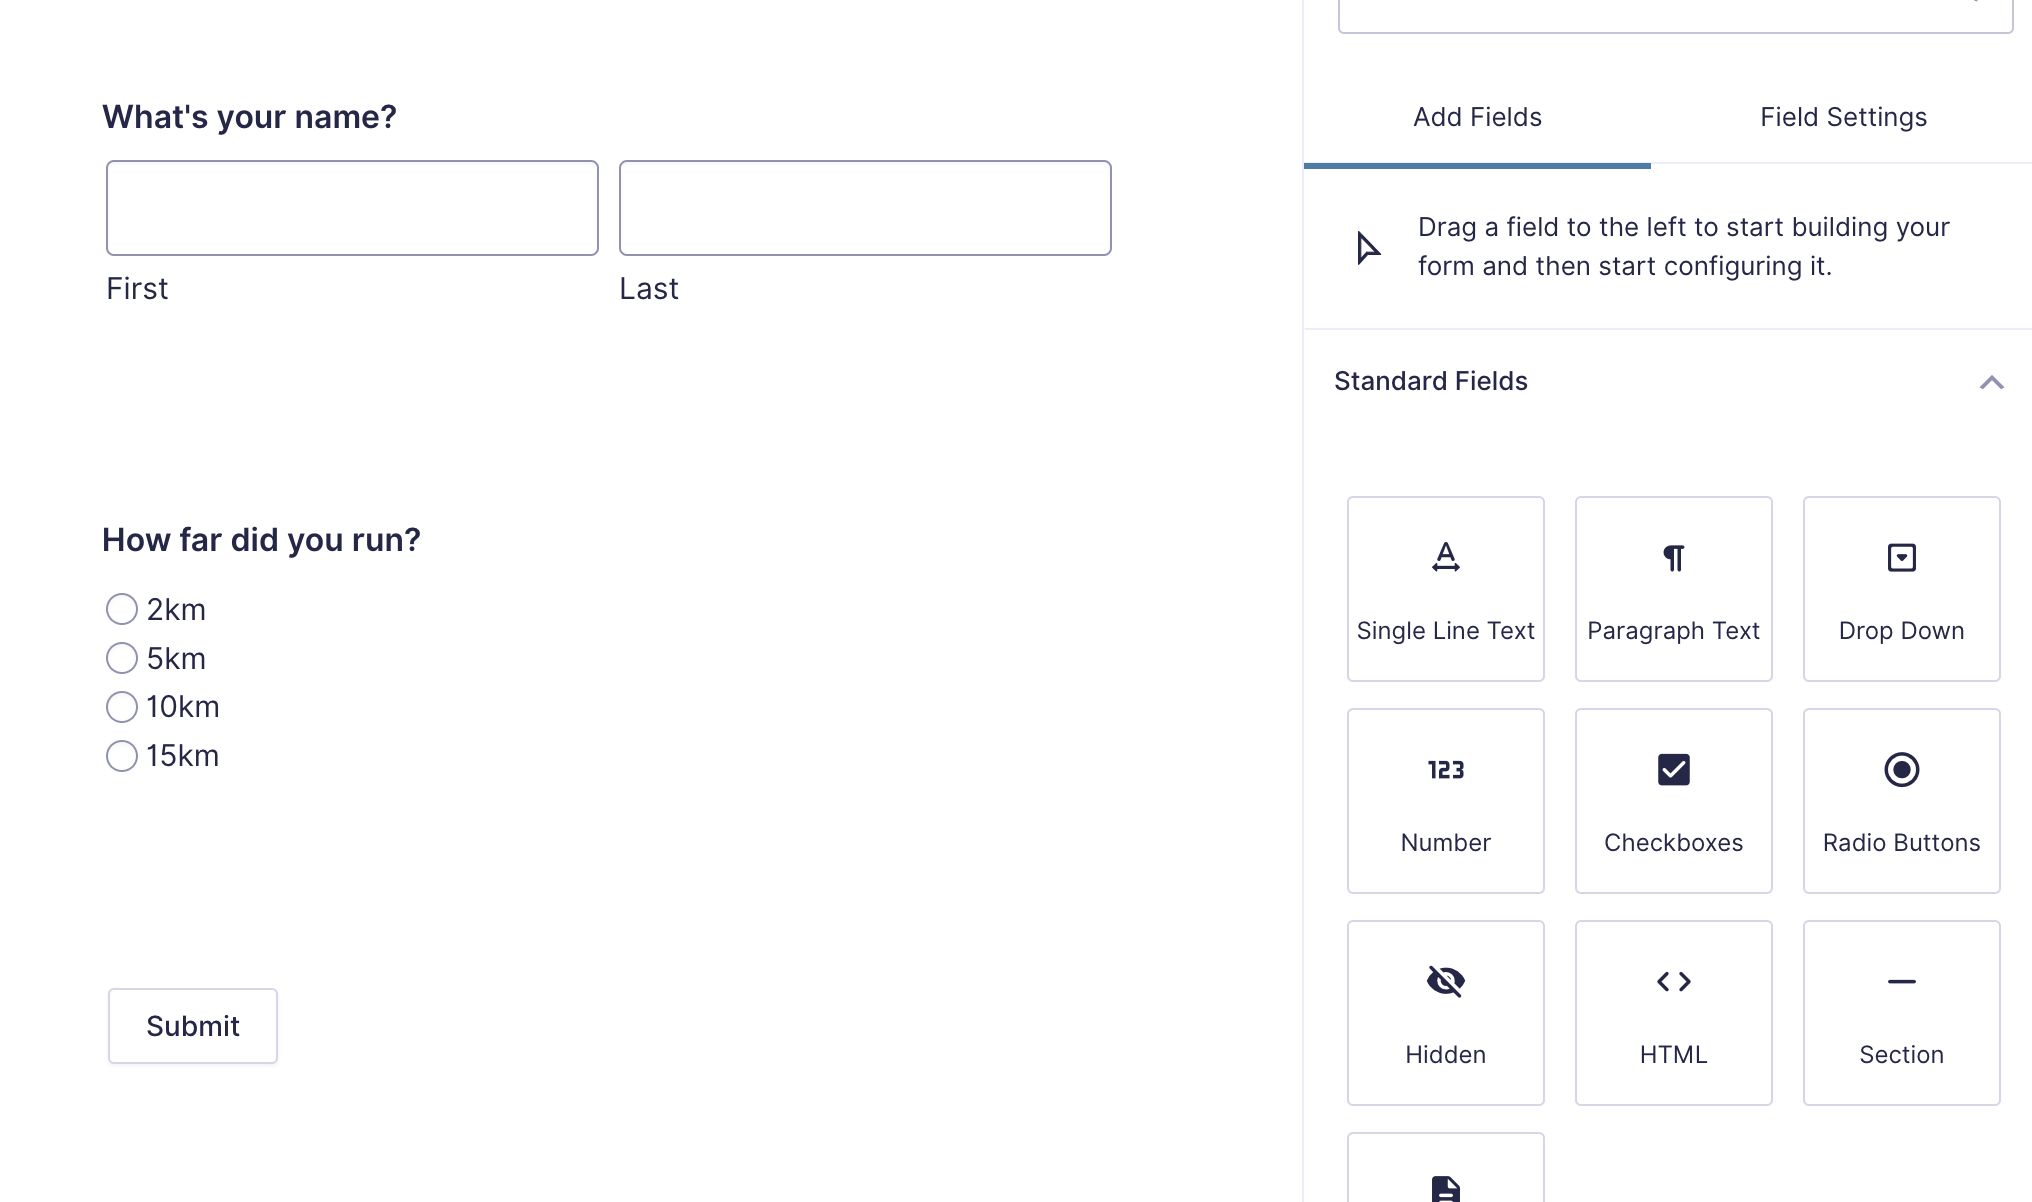
When you’re done, click Save Form.
Create a GravityCharts Feed
Now hover over Settings at the top, select GravityCharts and click Add New to create a new GravityCharts feed.
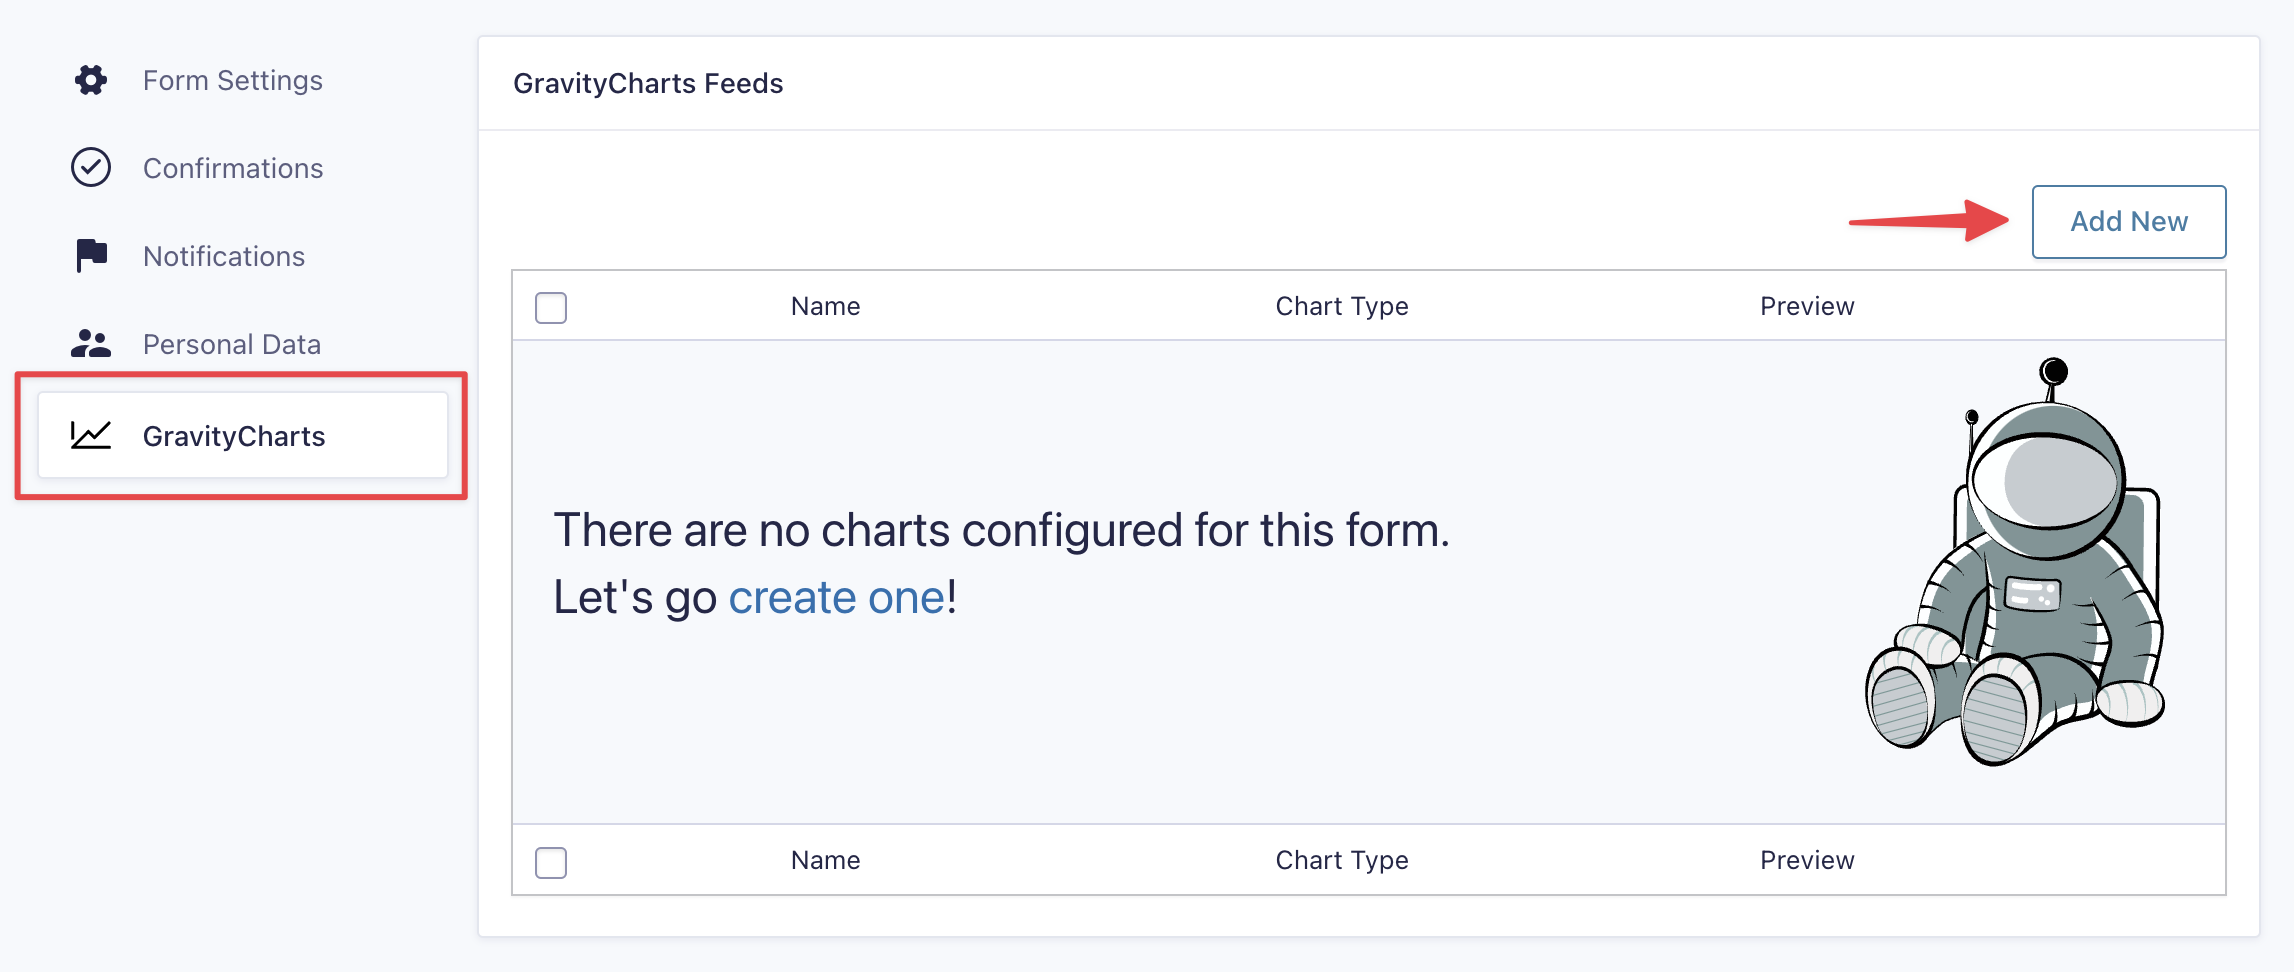
Now you can go through the steps below to create a new chart.
1. Select a Chart Type
Start by giving your chart a name and selecting a chart type.
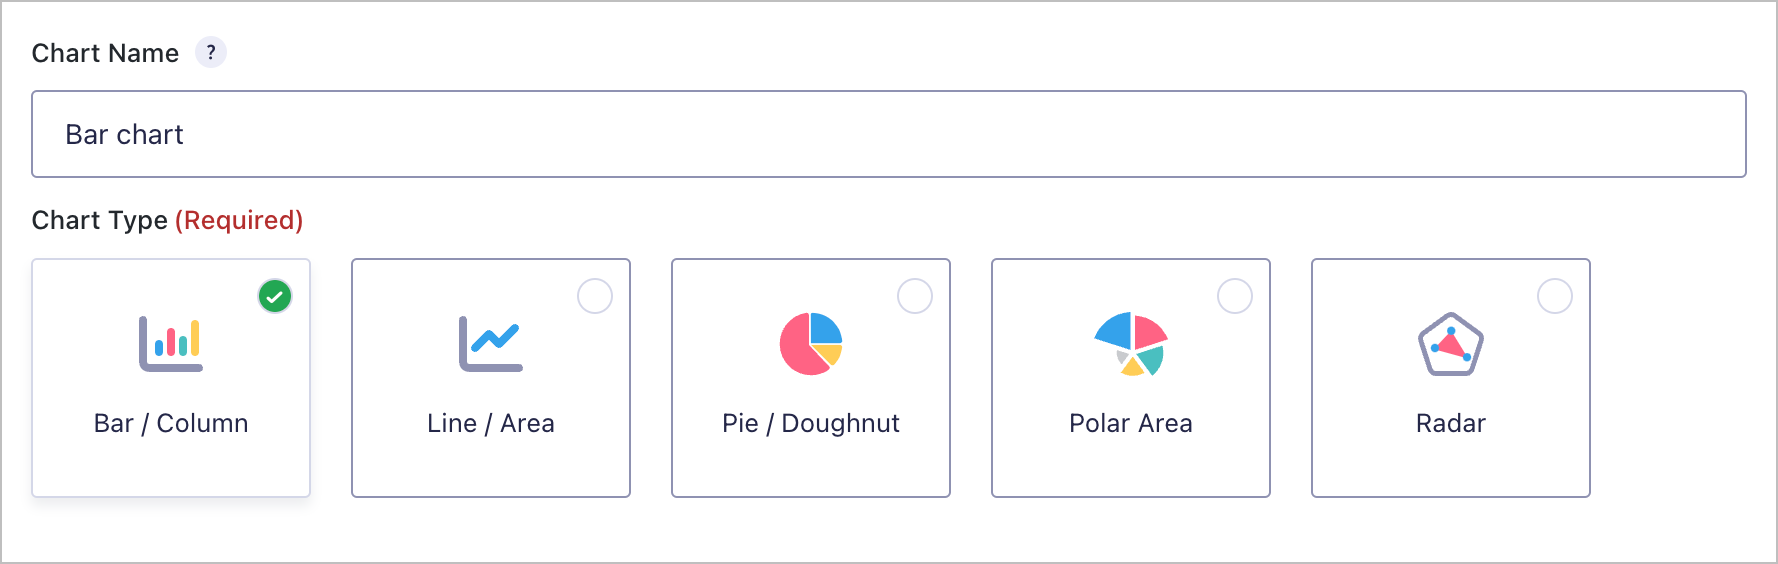
For more information on each of the five available chart types, read Differences Between Chart Types in GravityCharts.
2. Select a Data Source
After selecting a chart type, scroll down and select a data source. The data source is a form field that contains the data you want to display on your chart.
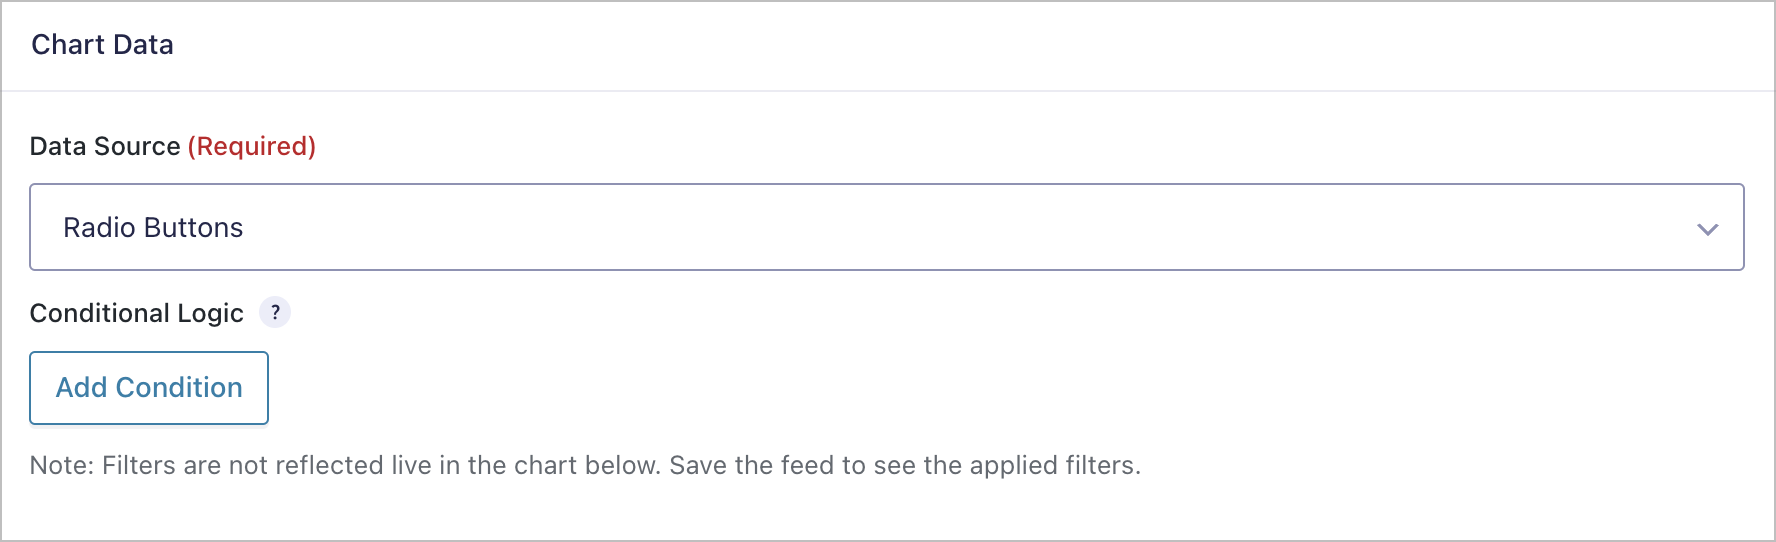
After selecting a data source, you also have the option to filter your data using conditional logic. This allows you to only include data in your chart that matches certain conditions.
Note: Your conditional logic filters will not be reflected in the live chart preview.
3. Style Your Chart
Finally, scroll down to the Chart Configuration panel. Here you’ll see a live-updating chart preview with up to four drop-downs at the top for adding custom styles.
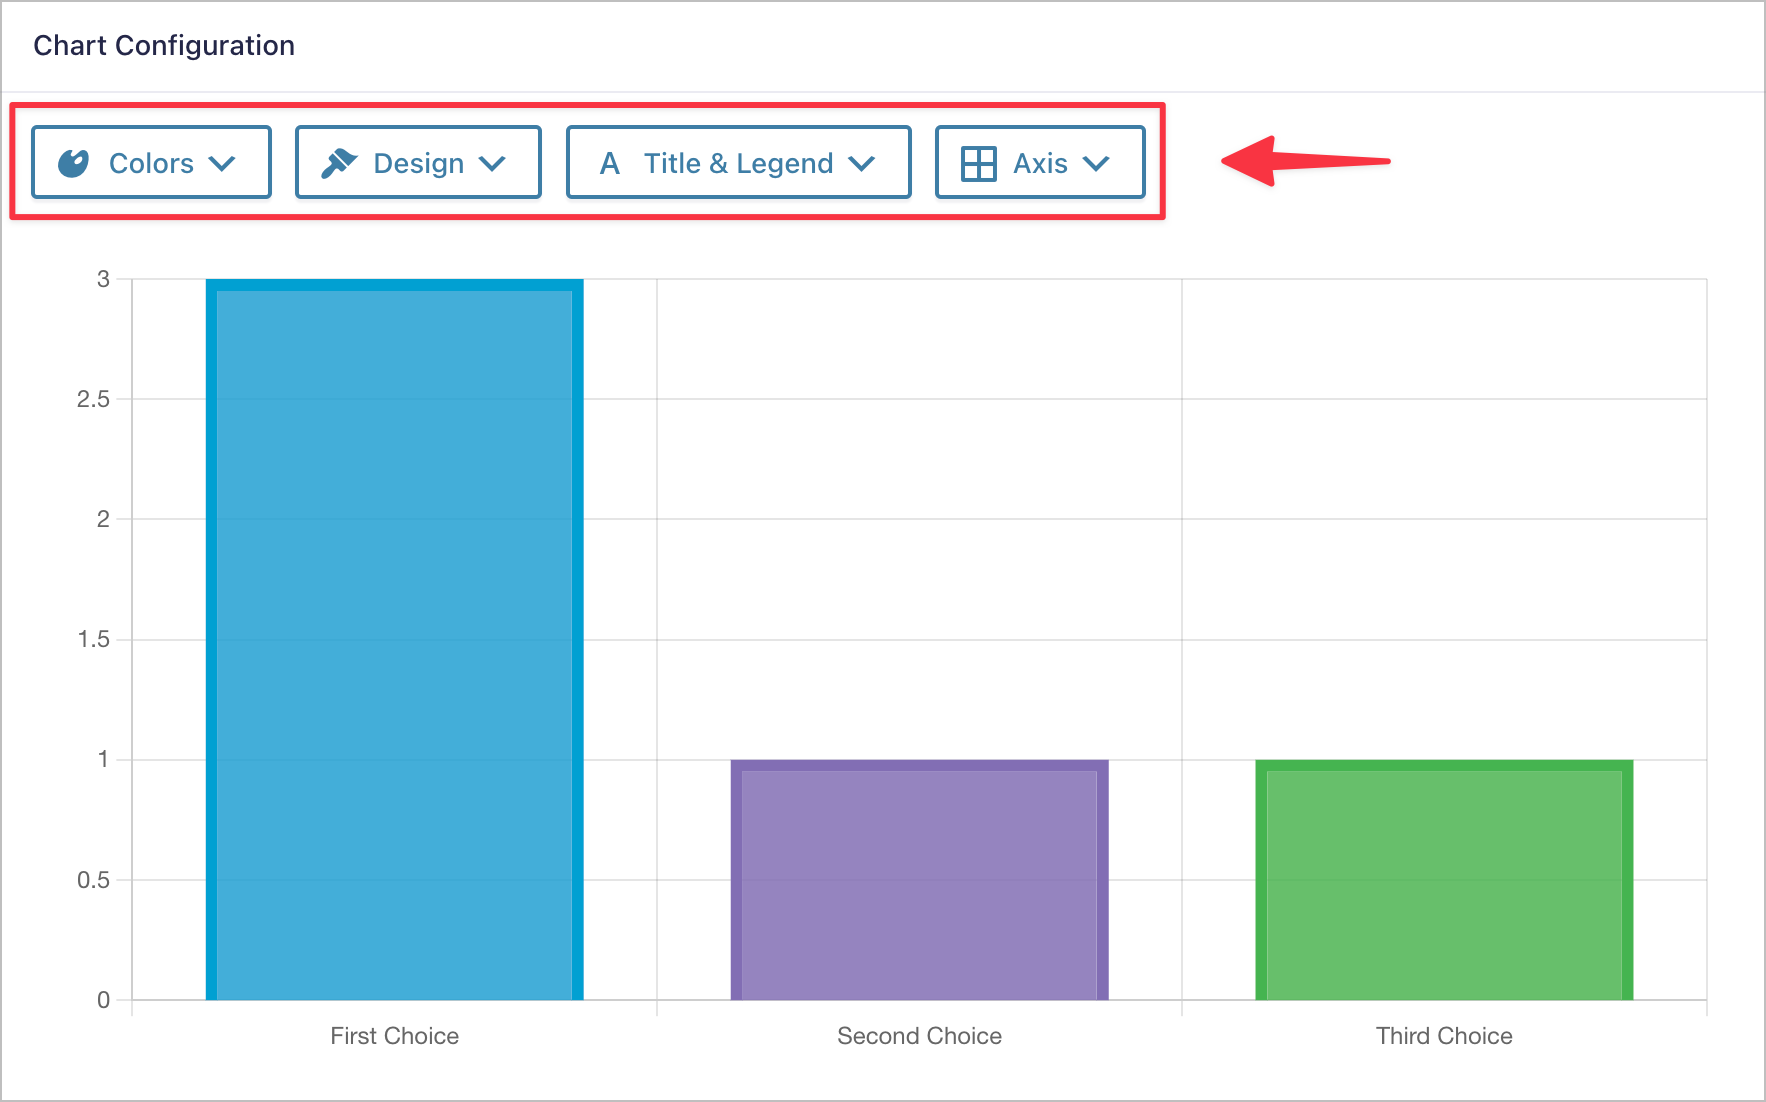
- Colors - Change the colors by selecting one of our predefined color palettes.
- Design - Select customizations that are specific to each chart type.
- Title & Legend - Show the chart title, enable the legend and choose where the legend should be positioned.
- Axis - Show/hide the grid lines, enable auto-scaling, and set a min and max scale.
When you’re happy with the design of your chart, click Save Settings.
Embed Your New Chart on a Page or Post
The final step is to embed your chart on a page or post. You can do this using the GravityCharts Gutenberg block. Simply edit your page, click on the ‘+’ icon to add a new block, and search for “GravityCharts”. After adding the block to your page, select your form and chart from the dropdown menus.
For more information about embedding charts on your website, read How to Embed Charts on Your Website.