_1@2x.png)
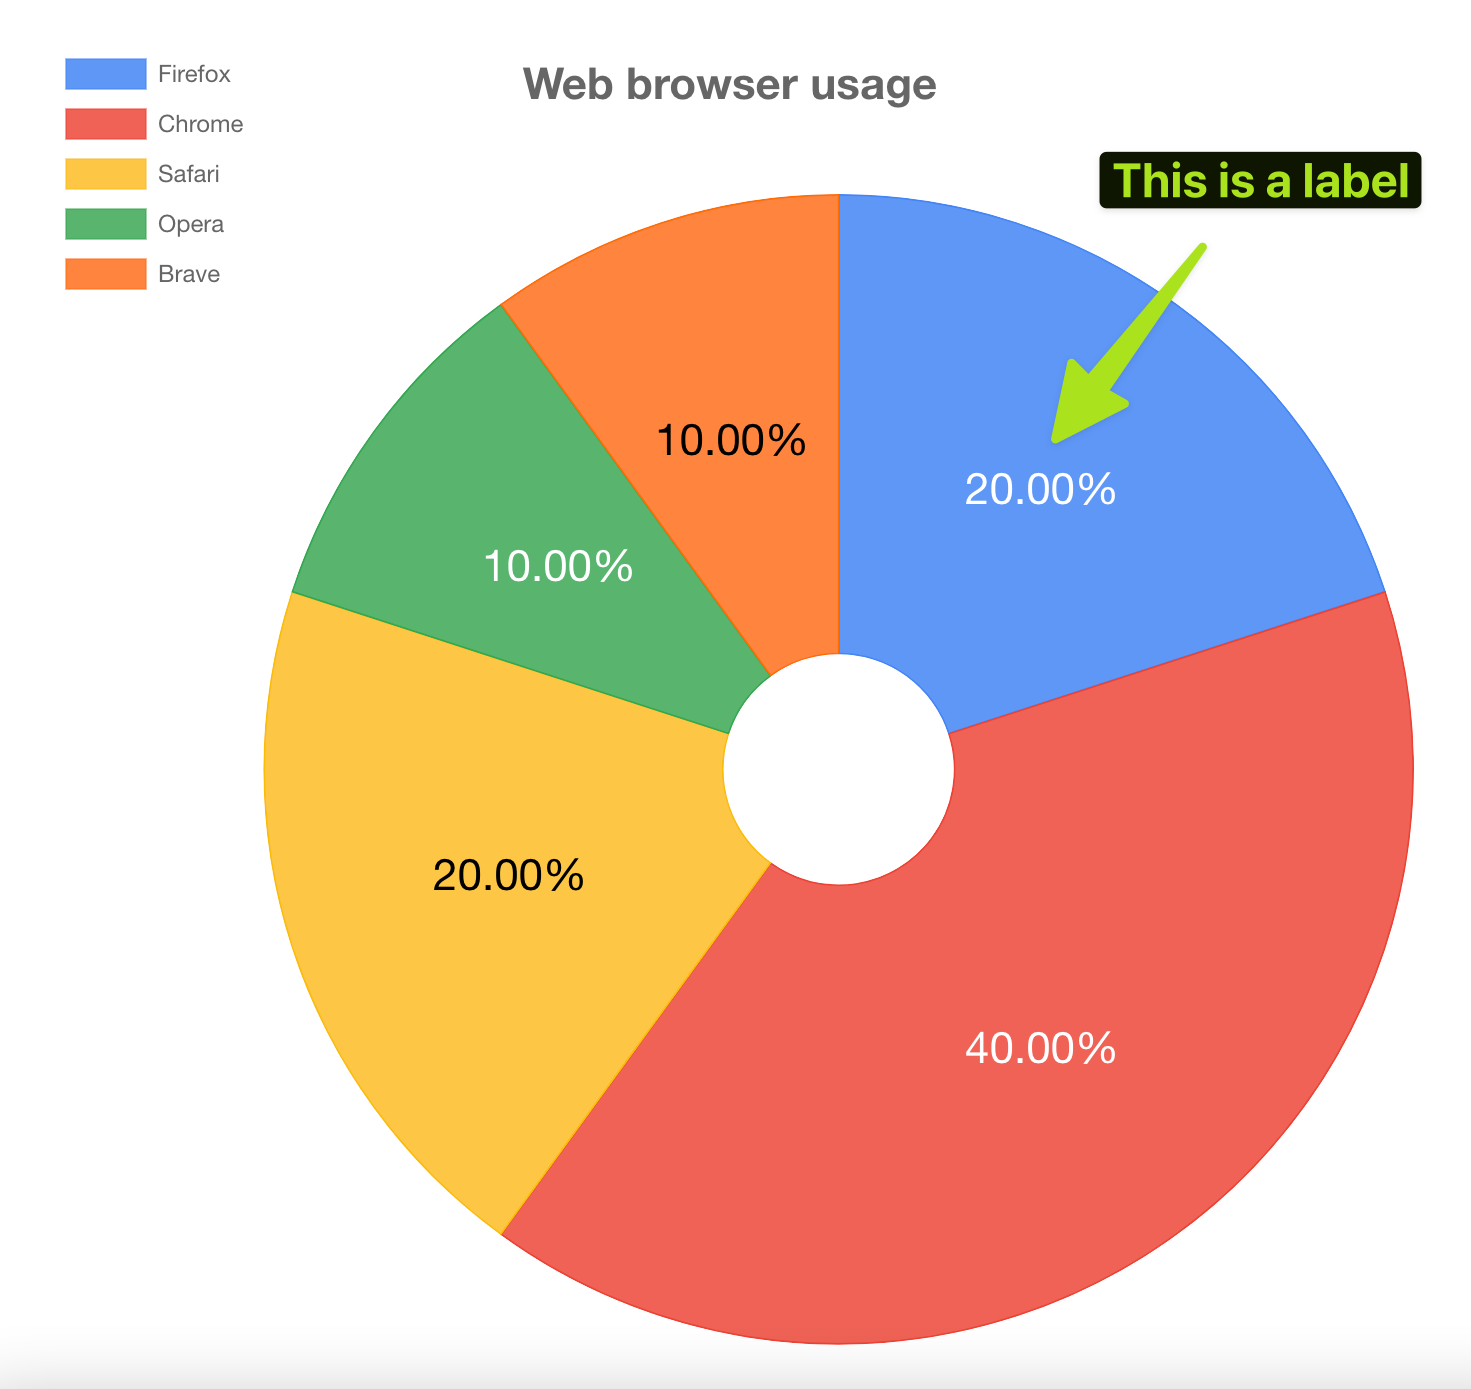
Adding data labels to a chart
GravityCharts allows you to add data labels to bar, column, pie, doughnut, and polar area charts.
How to add labels to your chart
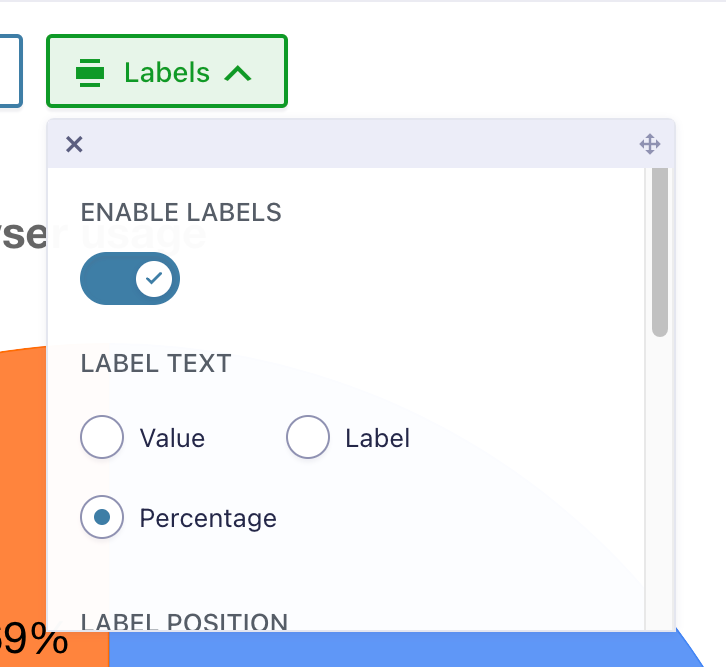
After creating a new chart, selecting a chart type, and configuring the chart data options, scroll down to the "Chart Configuration" panel. Here you will see a live-updating chart preview with several drop downs above for styling. Click on the "Labels" drop down and toggle labels to enable them for your chart.
 Label options
After enabling labels, scroll down to customize them using the below options:
- Label text: Choose whether the label should display the value associated with the field input, the label of the field choice, or the percentage value of the field relative to the other options.
- Label position: Choose where the labels should be placed.
- Label font size: Specify the font size for the label text.
- Label color: If set to "Automatic" GravityCharts will select an appropriate color. Choose "Custom" to specify your own colors.