_1@2x.png)
How to display summaries using a block, widget, or shortcode
You may want to group Gravity Forms entries by a specific field value and then perform math operations on entries within those groups.
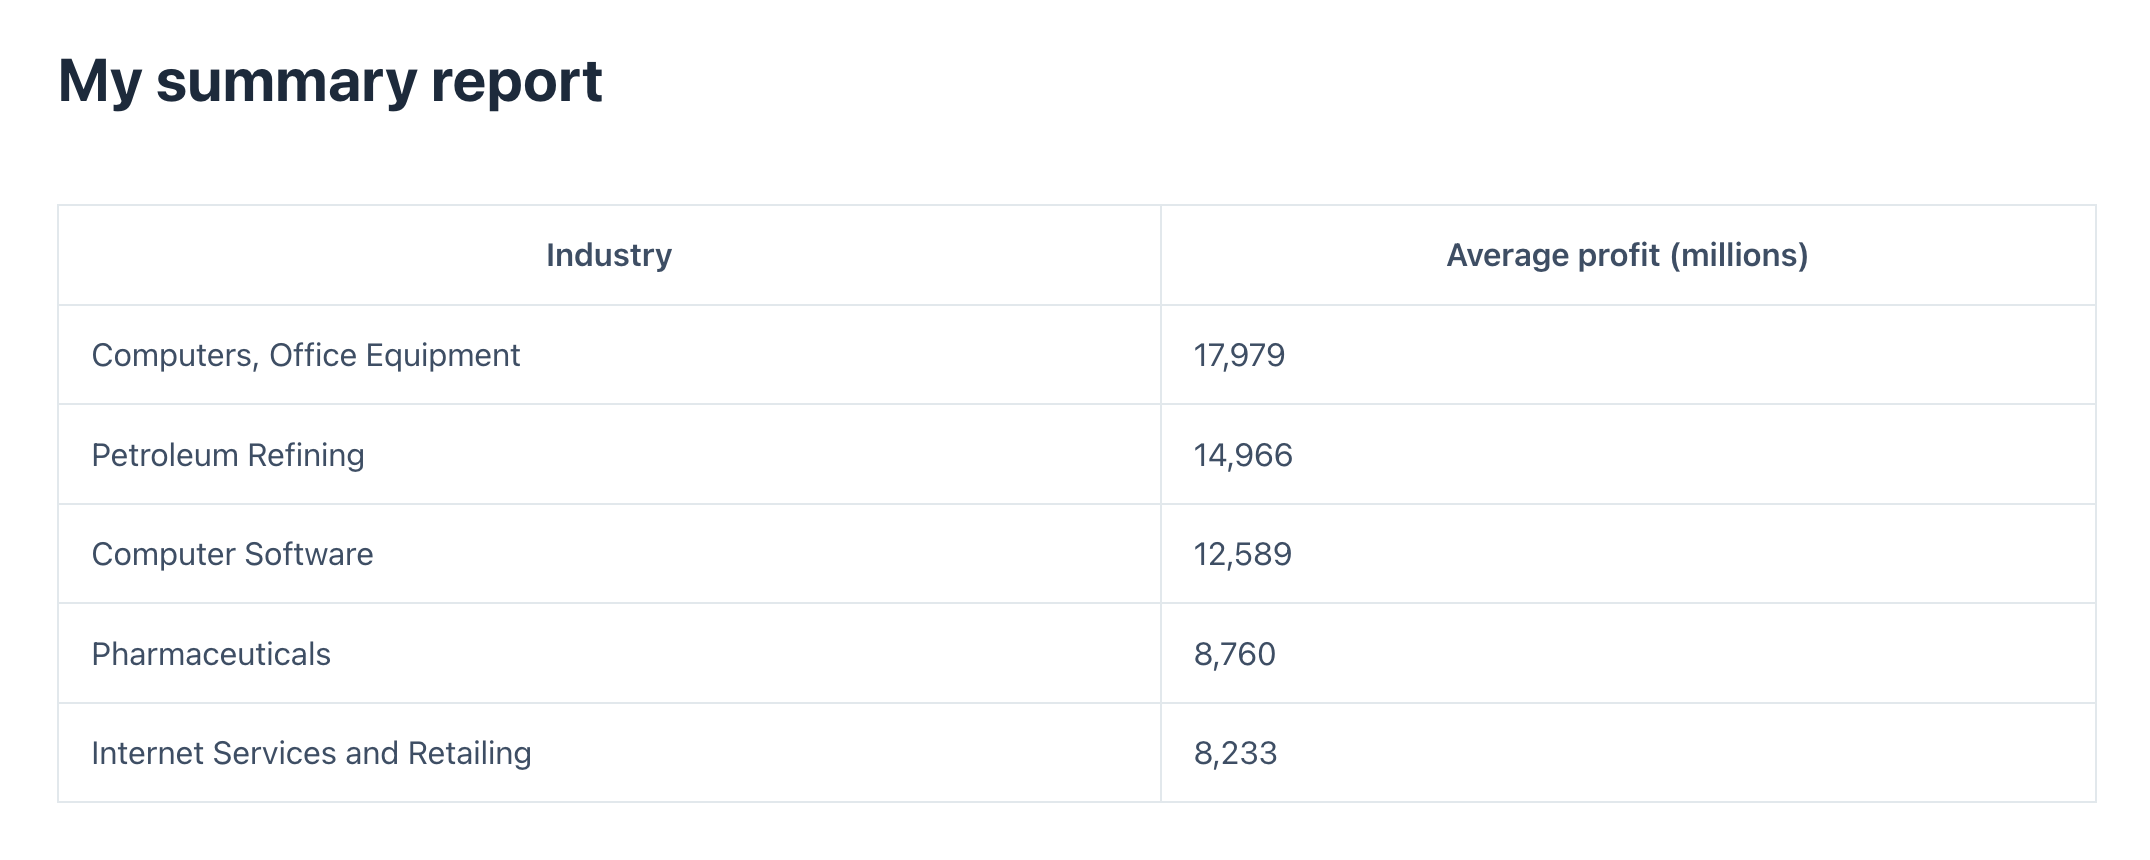
Here’s an example: You have a form for collecting data on companies and you want to know what the average profit is for companies in each industry.
There are 3 ways to do this:
- Using a WordPress block (data source can be a form or View)
- Using a shortcode (data source can be a form or View)
- Using the GravityView widget (only works if your data source is a View)
Prefer to watch the video?
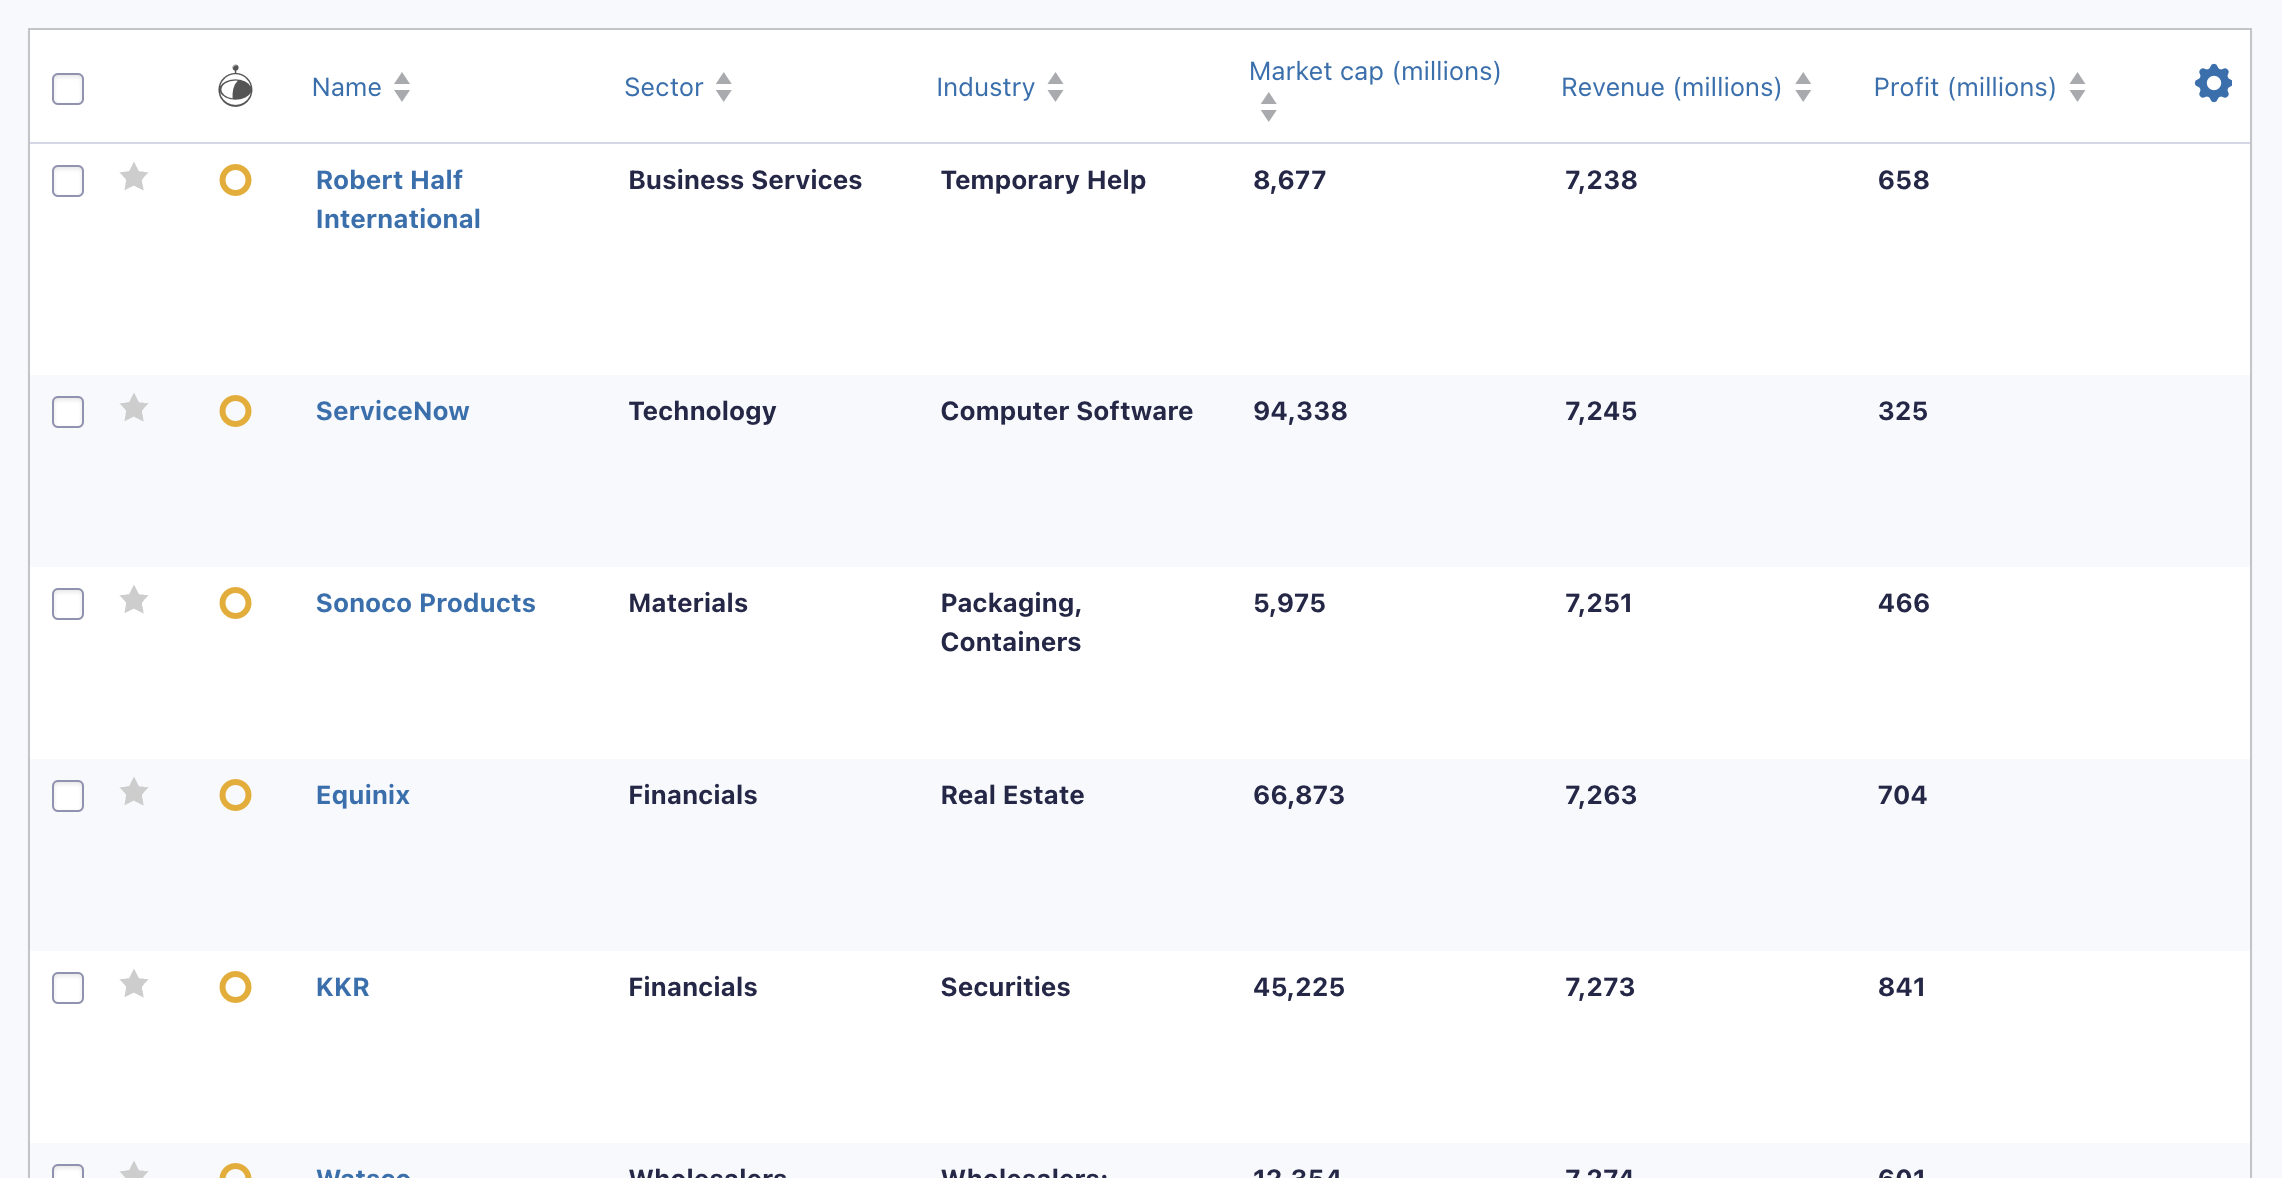
Here are our form entries. As you can see, each entry represents a single company, including its industry, sector, market cap, revenue, and profit. Now let's create a Summary Report to show the average profit per industry!
Using the block
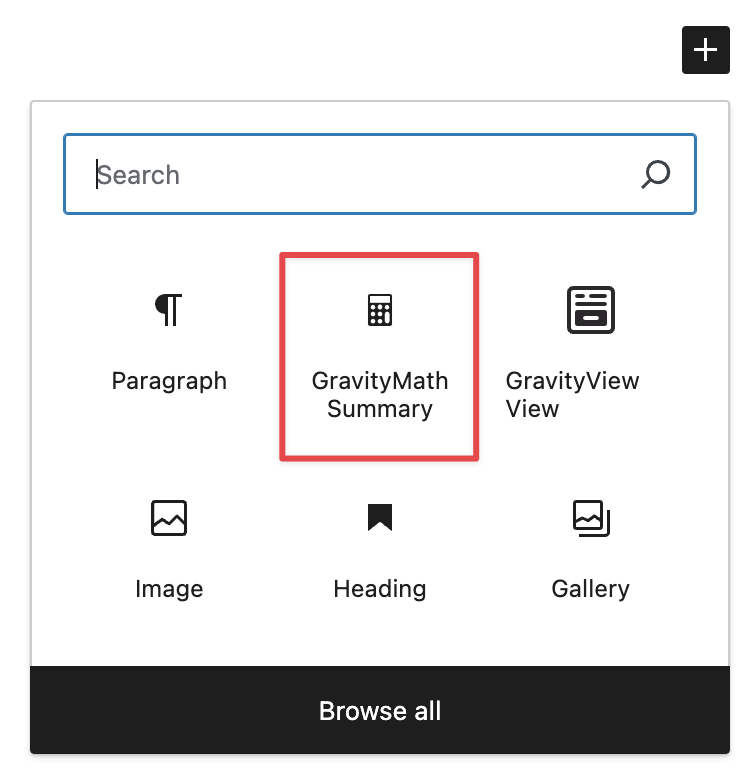
Start by editing an existing page/post or create a new one. Next, add the "GravityMath Summary" block to your page.
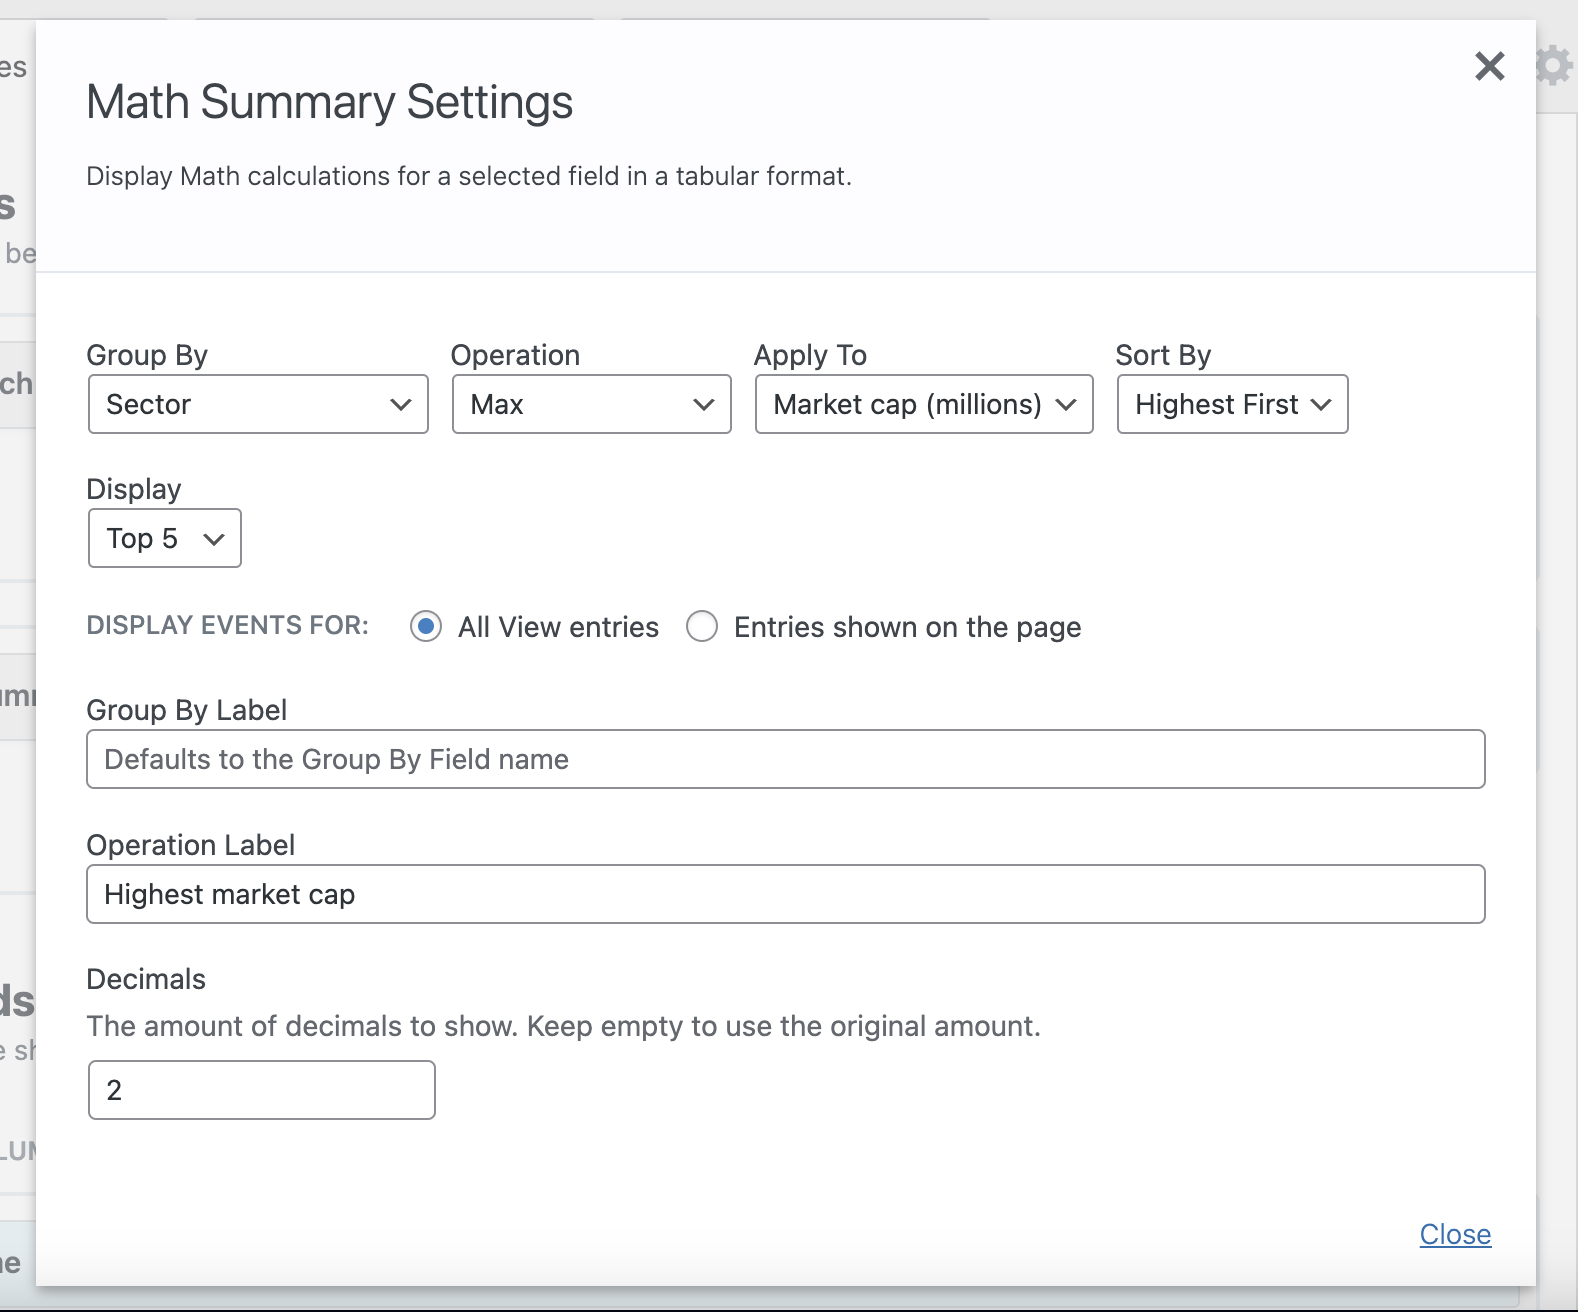
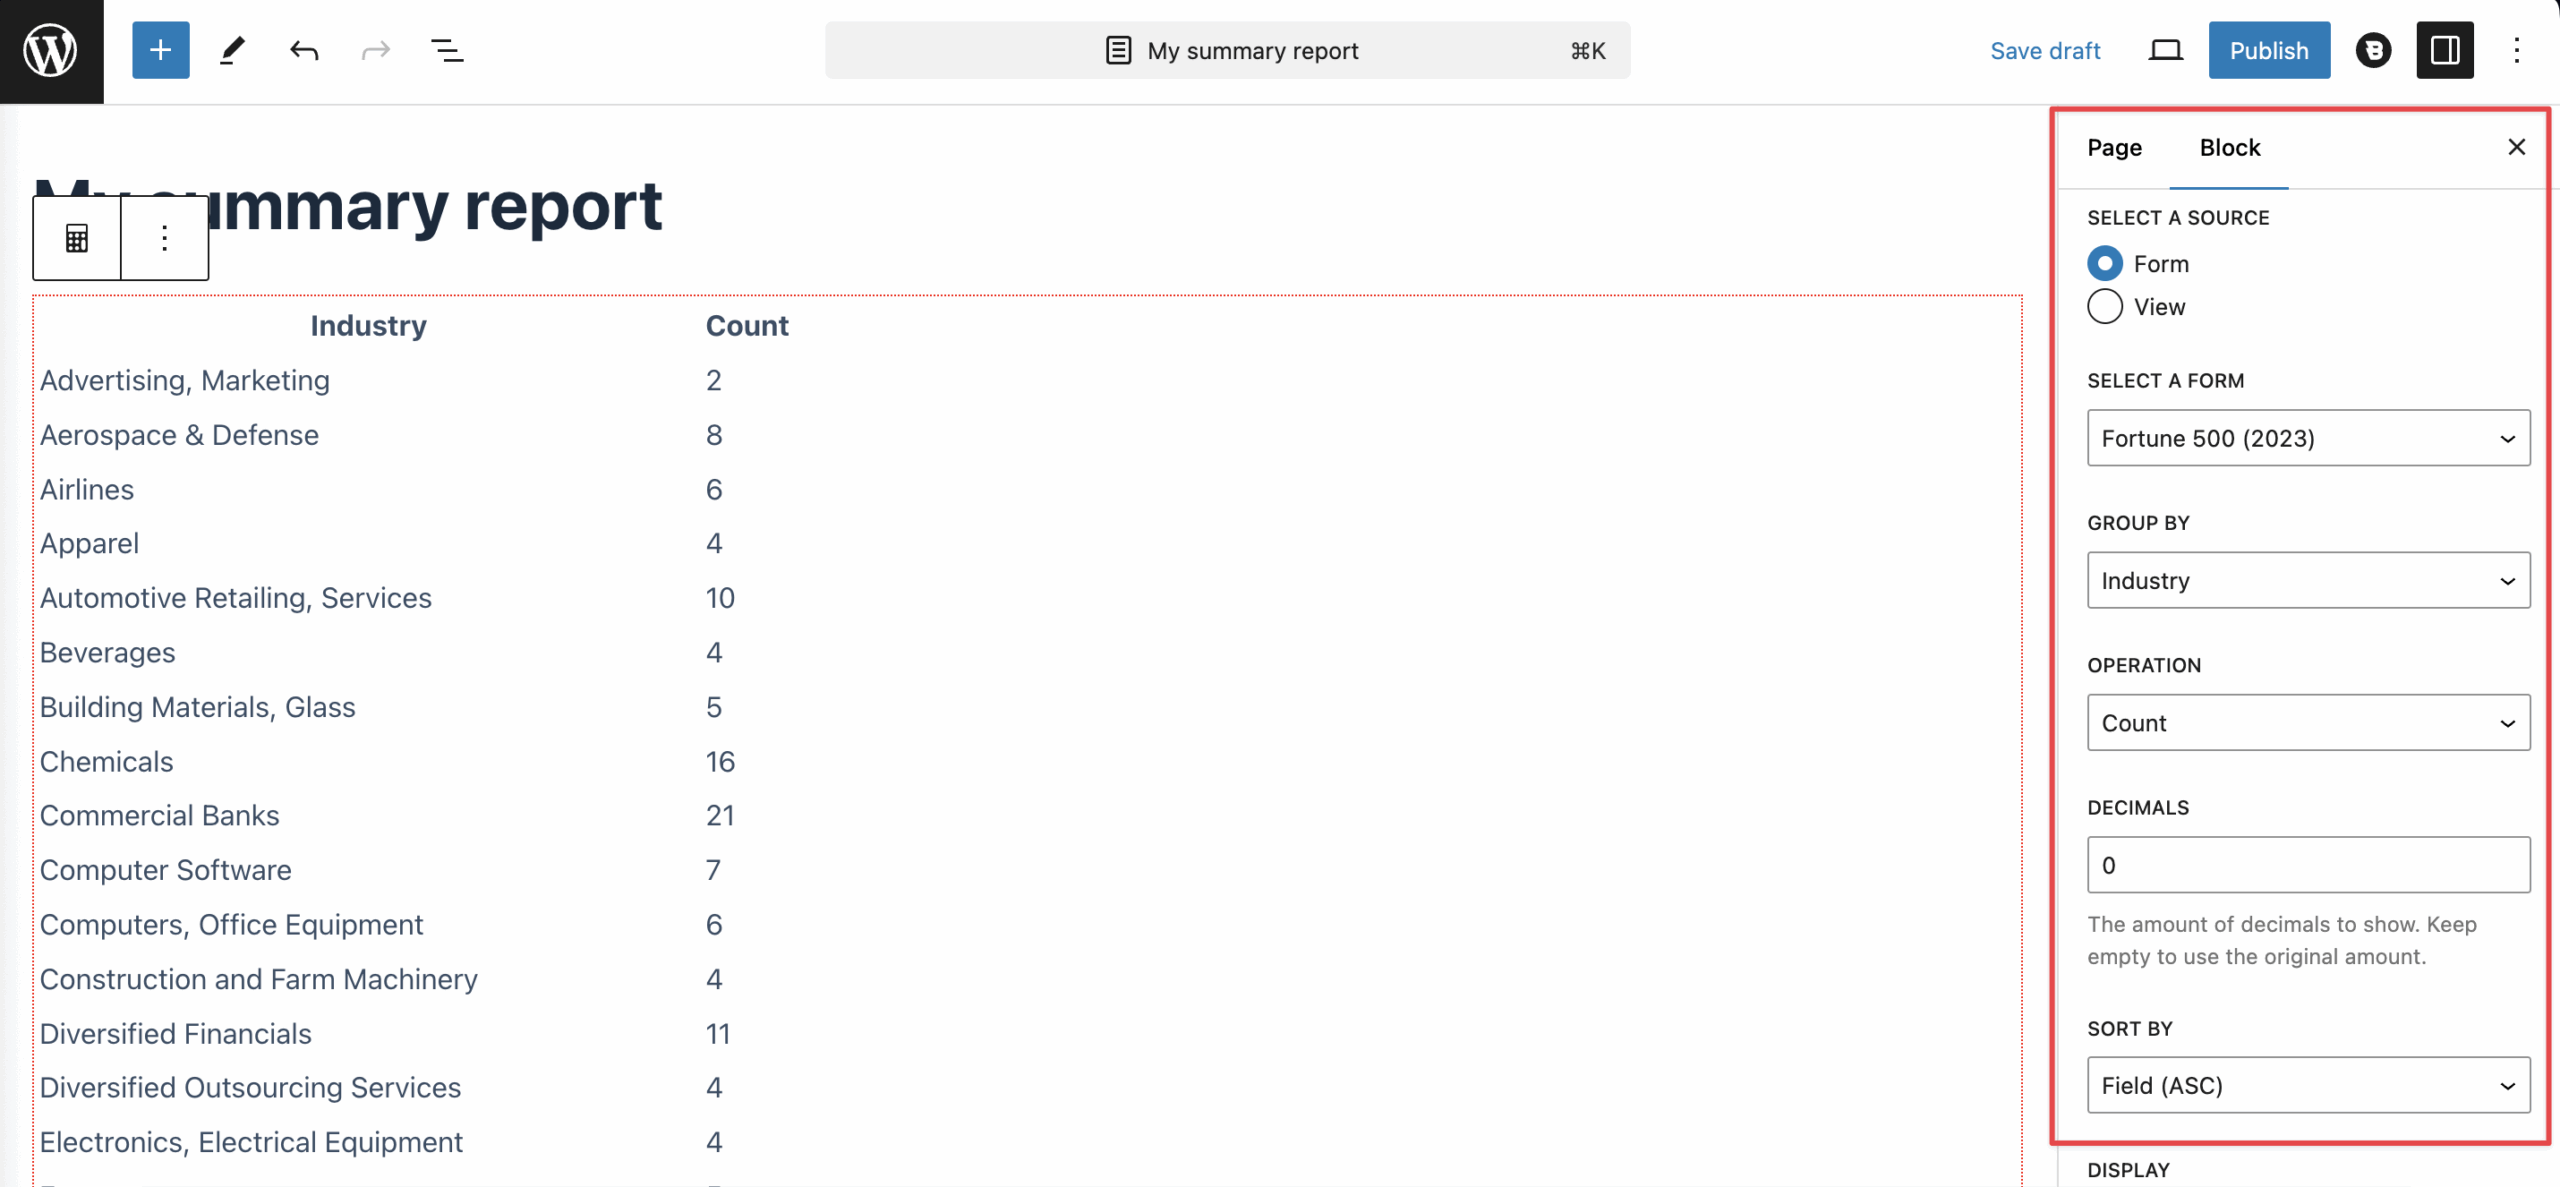
Now open the block settings on the right to configure the Summary Report.
Start by selecting a data source. This can be any form or View on your site. As you configure the report, the preview will update in real-time. Here’s a list of the options to configure:
- Group by – The field you want to group entries by.
- Operation – The mathematical operation to perform (either
count,sum,average,max, ormin). - Apply to – The field you want to perform the operation on.
- Decimals – The number of decimal places for the output.
- Sort by – Sort output
ASCorDESC. - Display – The number of rows to display in the summary.
- Group by label – The group by column title.
- Operation label – The operation column title.
Using the shortcode
You can also create Summary Reports using the [gravitymath] shortcode.
If your data source is a form:
[gravitymath action="summary" form_id="1" group_by="1" operation="SUM" number_field="3"]
The group_by and number_field parameters require a field ID as a value.
If your data source is a View, simply replace the form_id parameter with id and set it equal to your View's ID.
Several other shortcode parameters are also supported:
decimals– Can be0,1,2,3, etc depending on how many decimal places you want.sort_by– Eithermath-asc,math-desc,field-ascorfield-descwheremathrepresents the outcome of the operation, andfieldrepresents the group by field value.display– Eitherall(default),top3,top5ortop10.group_by_label– The label used for the field column in the output table. Defaults to the name of the field.operation_label– The label for the operation column in the output table. Defaults to the operation used.
Using the GravityView widget
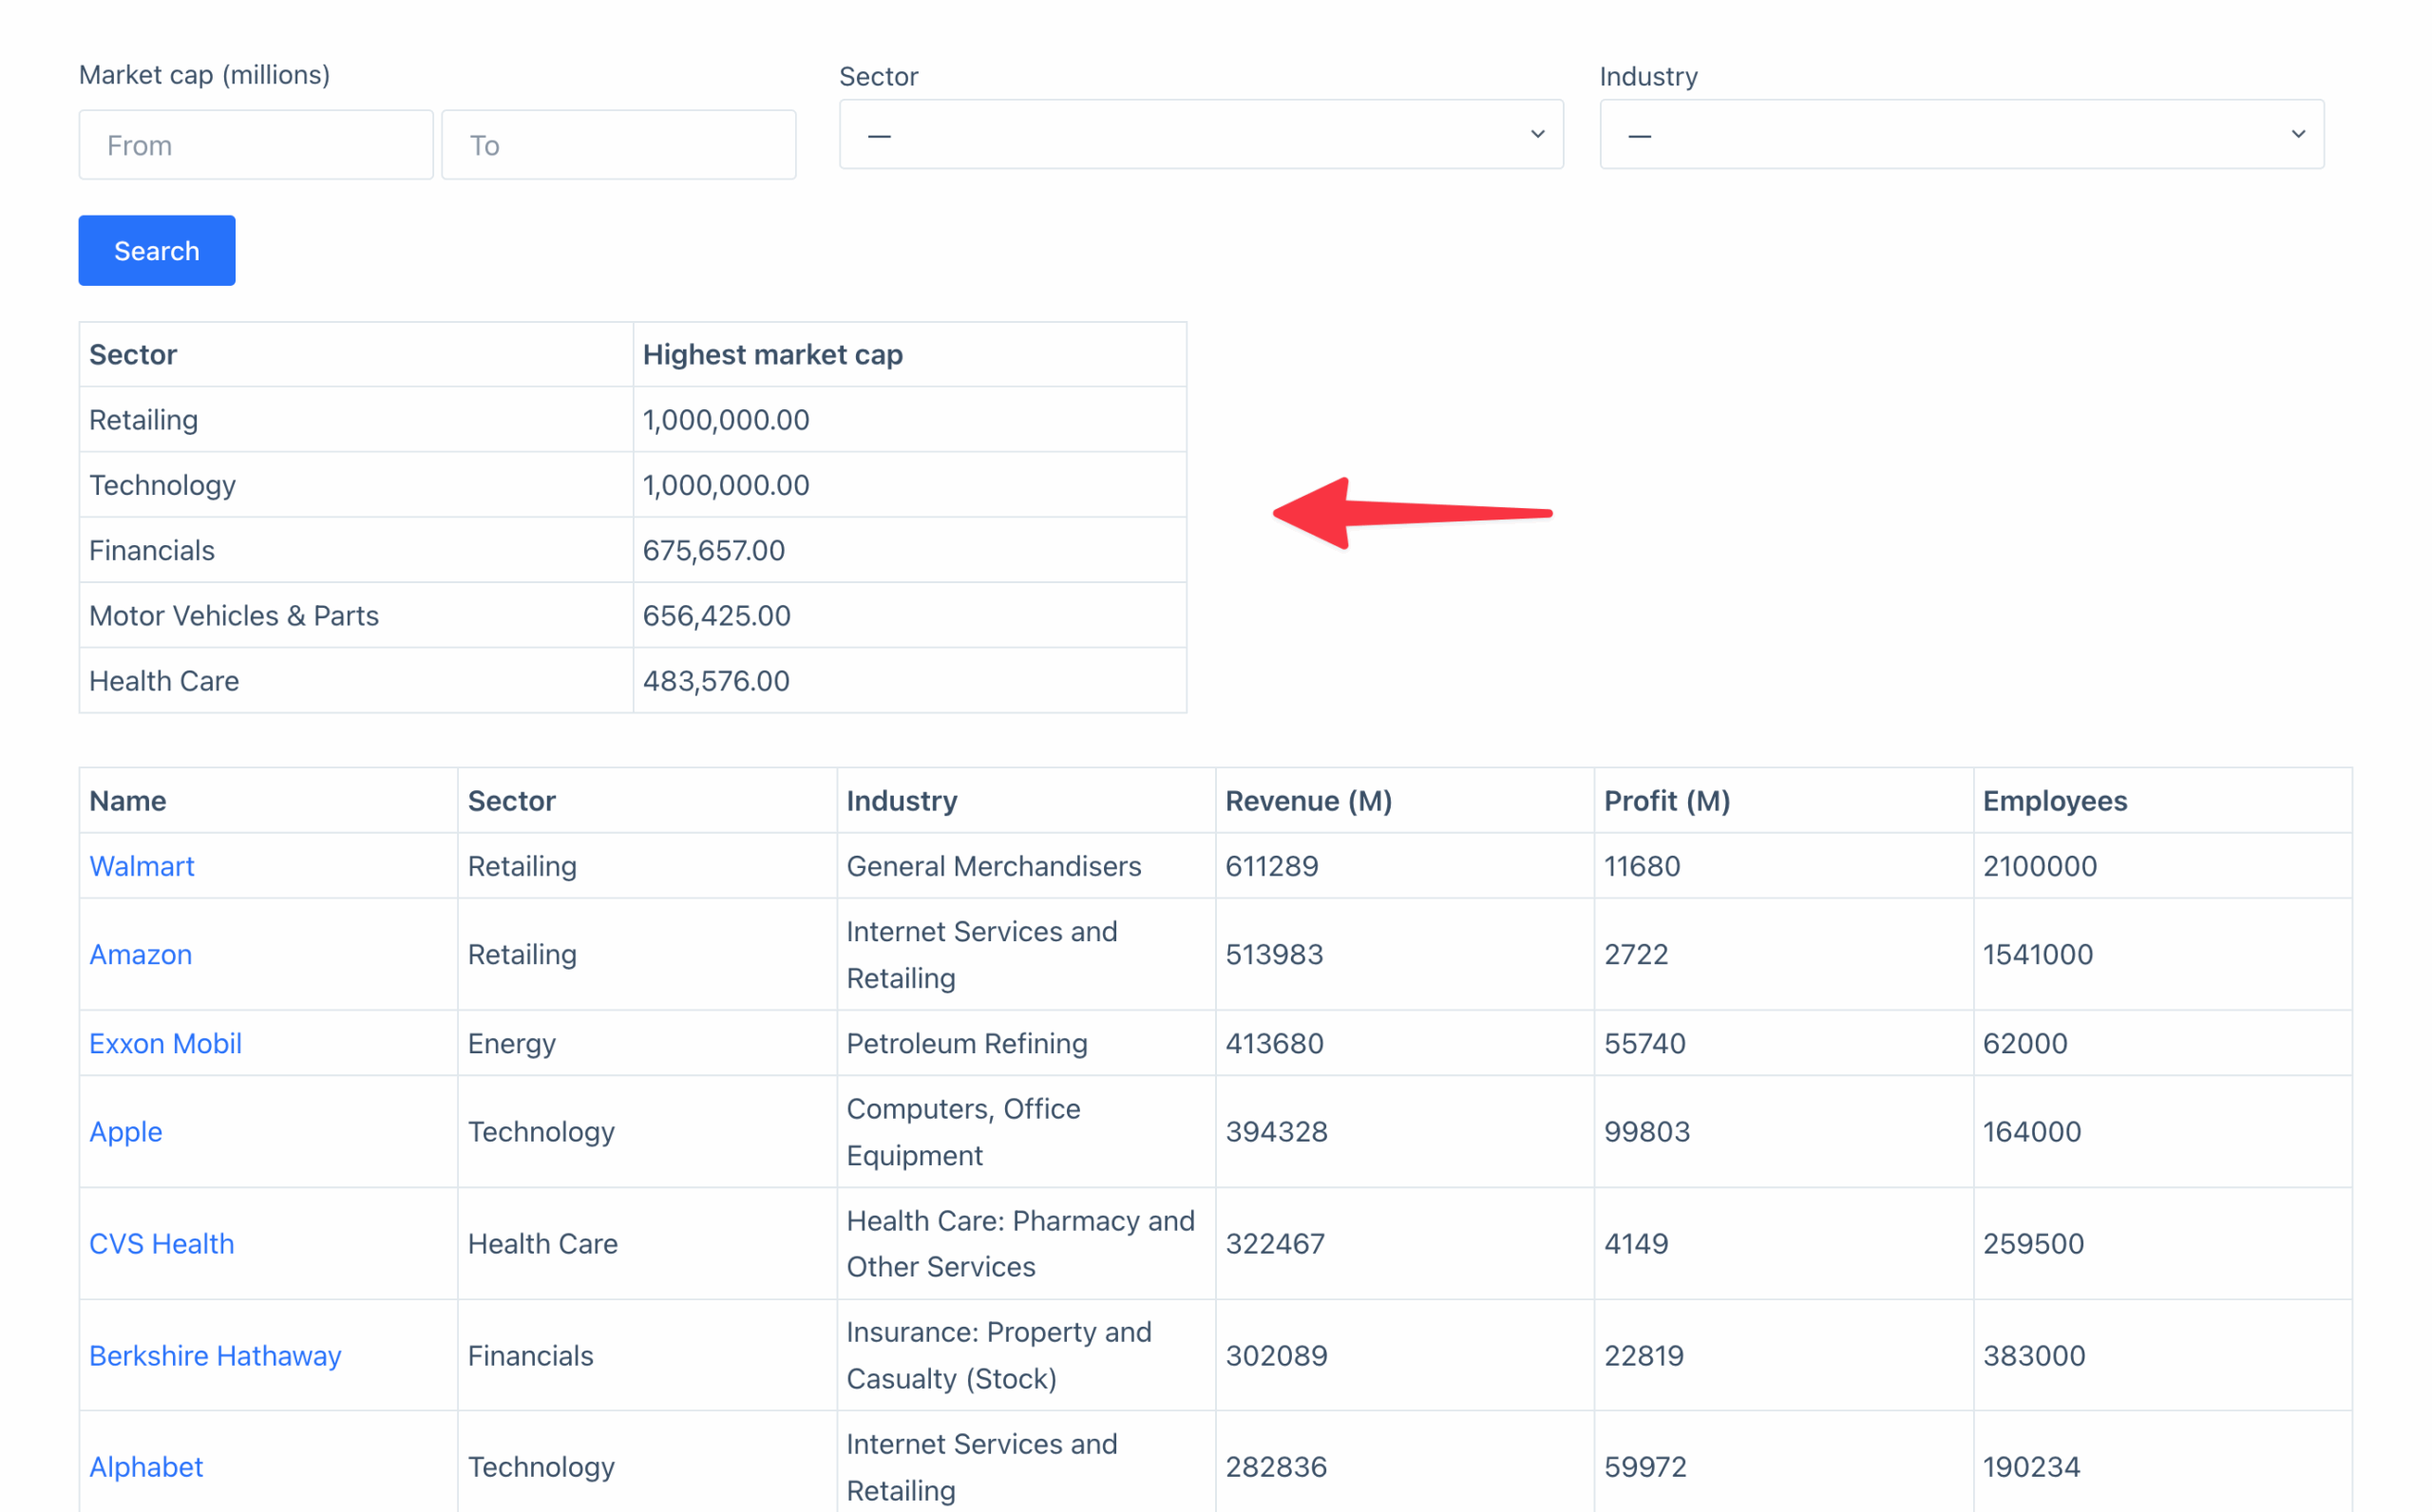
If you want to add a Summary Report to a View that updates automatically when searches are performed, you can use the GravityMath Summary widget.
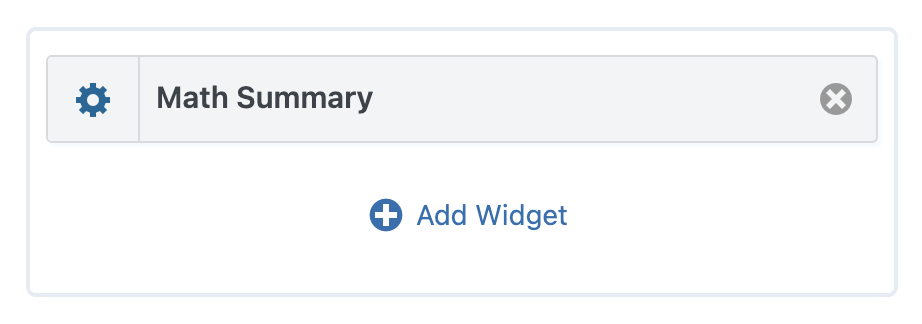
Simply edit your View, click on "Add Widget" and select "Math Summary".
After adding the widget to your View, click on the gear icon to open the widget settings. Here, you can configure the Summary Report.